
Asset Topology Graph
TestNet provides an intuitive Visual Asset Topology Graph that displays the relationships between 8 core asset types, helping security teams inspect attack surfaces from a global perspective.
1. Entering the Graph
- Open "Project Management" and enter the target project's Project Workbench (requires project context).
- Switch to the "Asset Graph" tab in the workbench; you can also visit
/asset/graphdirectly.
2. Three Interactive Graph Views
The topology graph includes three visualization layouts to support different analysis workflows:
2.1 Attack Chain (Tree Layout) — Default
- Visualization: A hierarchical tree diagram spreading outwards from parent organization or root domains.
- Use Case: Best for tracing asset ownership hierarchies, e.g.,
Company→Domain→Subdomain→Web App→API.
2.2 Exposure Matrix (Sankey Layout)
- Visualization: A flow diagram representing the volume flow and connections between different asset types.
- Use Case: Excellent for evaluating distribution proportions across various asset classes.
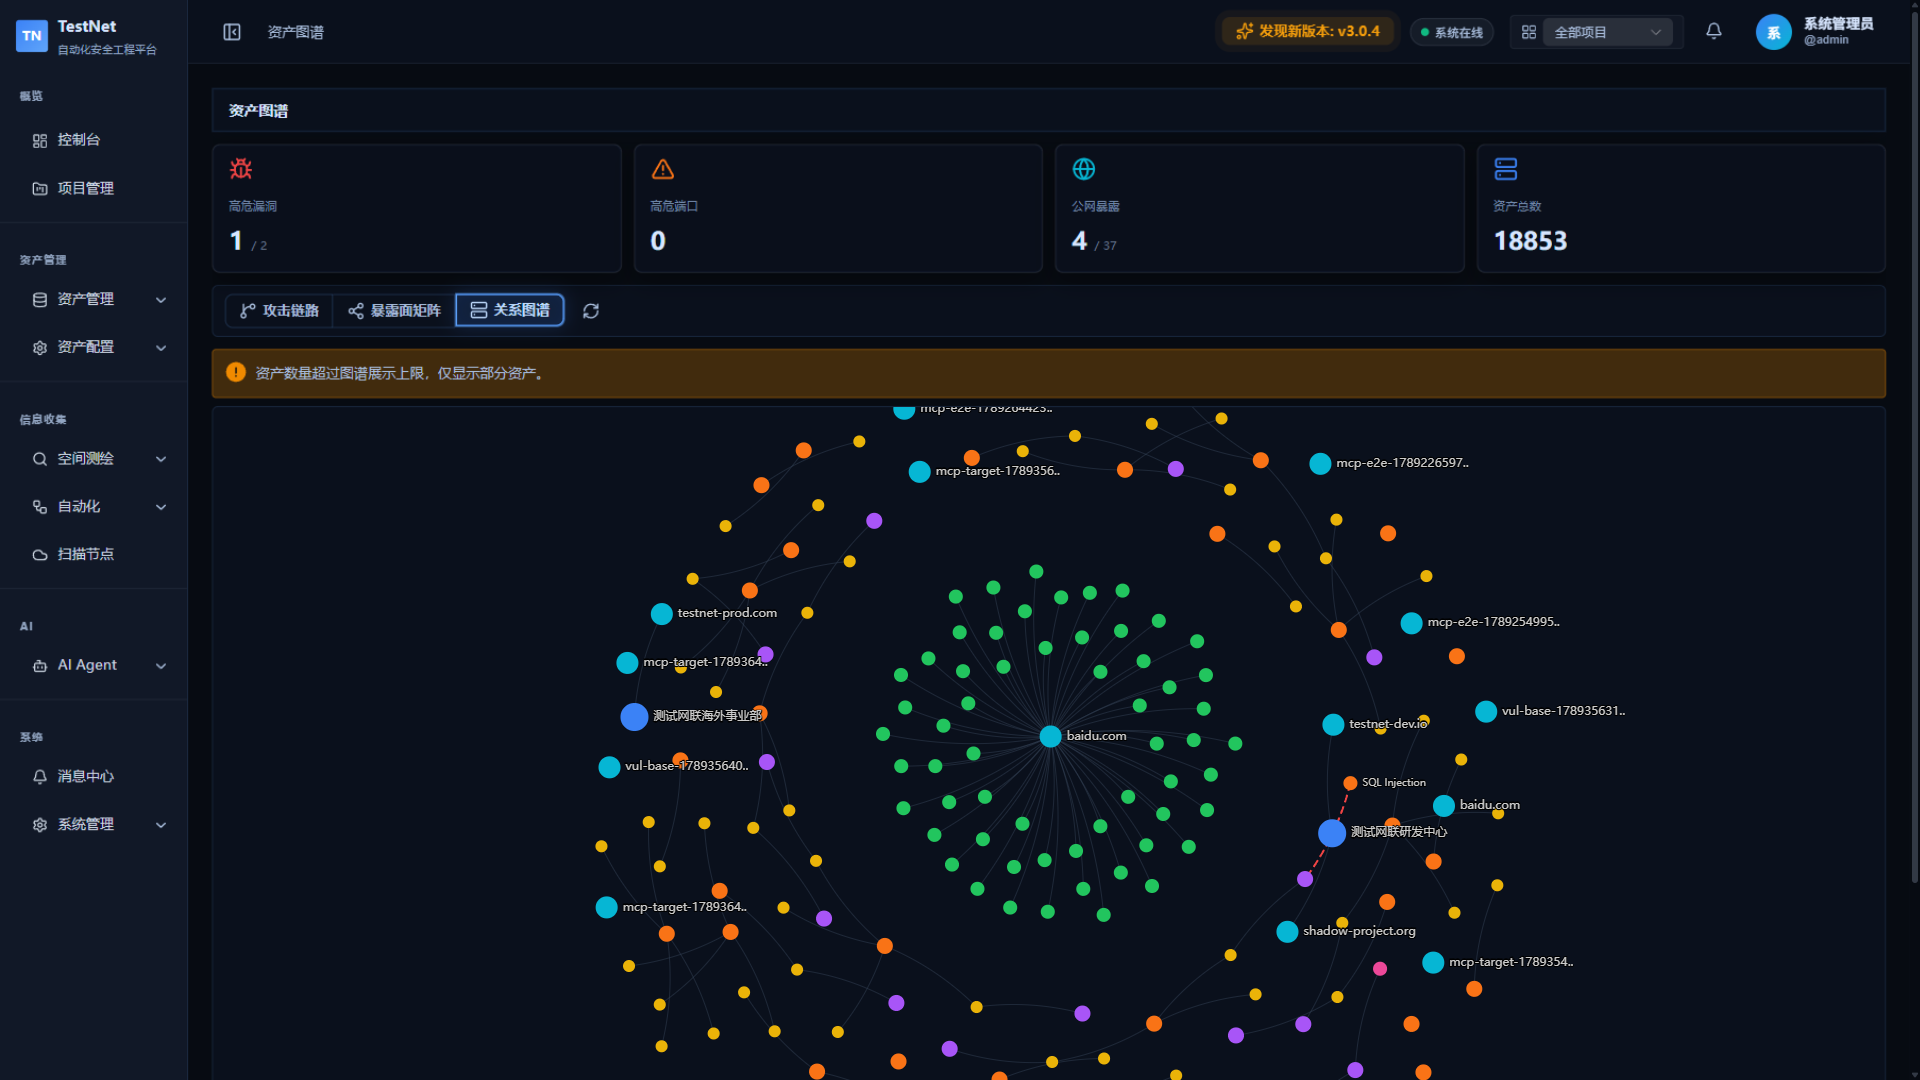
2.3 Relationship Graph (Force-Directed Layout)
- Visualization: A dynamic network graph where nodes are automatically laid out via physics simulation.
- Use Case: Overall relationship discovery. Helps identify key bridge assets, such as an IP associated with many subdomains, or a host serving a massive number of API endpoints.
- Interaction: Scroll wheel to zoom, drag nodes to reposition them.
3. Node Types and Visual Indicators
Nodes in the graph are distinguished by distinct icons, colors, and dimensions:
3.1 Visual Legend & Node Color Palette
In the Relationship Graph view, an interactive legend at the bottom of the canvas lets you toggle node categories with a single click:
- Organization & Domain Layer: 🏢 Company (Blue
#3b82f6), 🌐 Domain (Cyan#06b6d4), 📡 Subdomain (Green#22c55e) - Host & Network Layer: 🖥️ IP Address (Orange
#f97316), 🔌 Port Service (Yellow#eab308) - App & Security Layer: 🌐 Web App (Purple
#a855f7), 🔗 API Endpoint (Pink#ec4899), ⚠️ Vulnerability (Red#ef4444)
Entity Attributes & Hierarchy
The asset attributes and relationships are managed by the 8 core models. See Asset Models.
3.2 Red Risk Halo
If a particular asset node (such as a Web application or IP host) has high-severity vulnerabilities, its node border is highlighted with a glowing red halo (aura) to guide security analysts to prioritize their mitigation.
4. Interaction and Drill-down Analysis
- Node Hover: Hovering over a node displays a tooltip with its name, type, and severity.
- Node Click Drawer:
- Clicking a node slides out the Asset Detail Drawer on the right side.
- The drawer shows key-value details such as name, type, status, severity, remediation status, service, network type, relation counts, and risk level.
- A "View Asset List" button navigates directly to the list page for that asset type (project filter applied) for deeper editing and drill-down.
Related Documentation
- Asset Models — 8 core asset types and topology relationships
- Asset Overview — Common operations and tag management
- Asset Operations — Batch import/export and change history