
Dashboard
The Dashboard is the default home page after logging in to TestNet. It helps you quickly grasp asset scale, risk posture, task status, and node health.
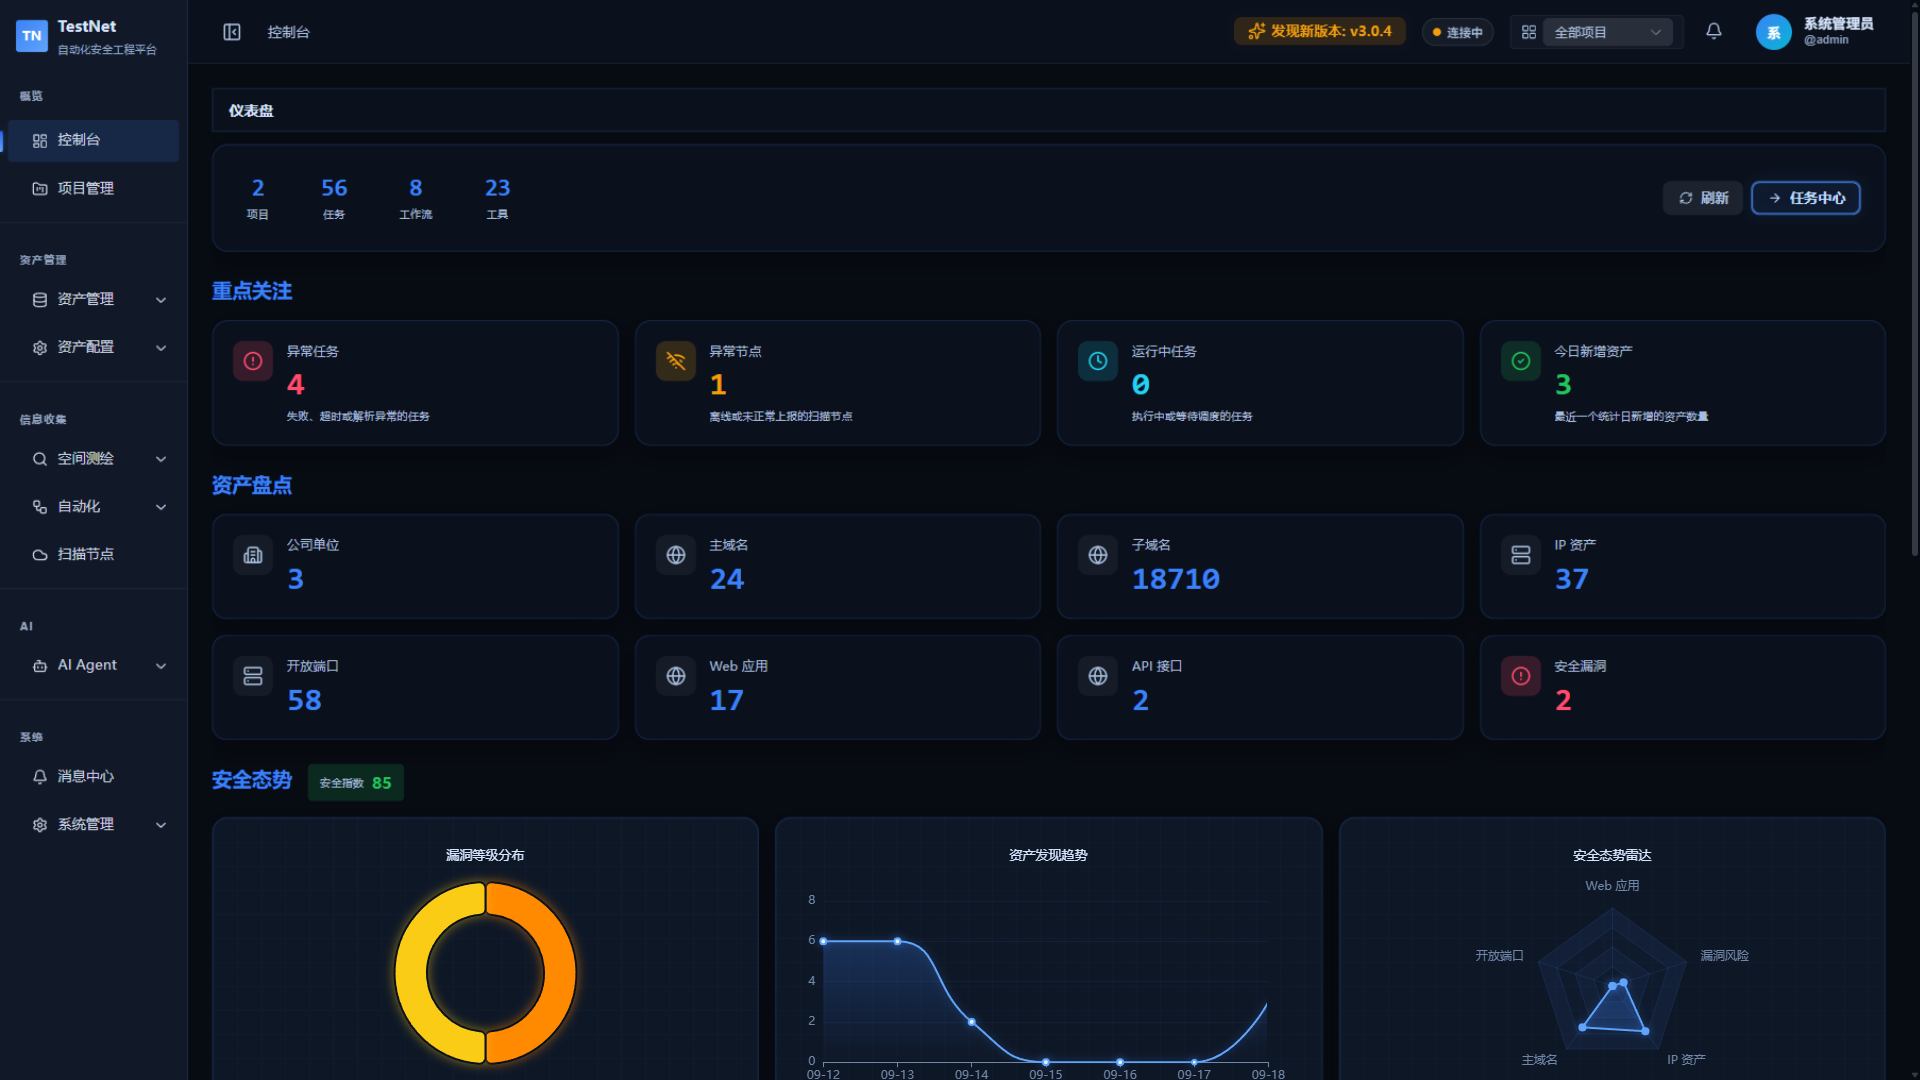
Attention Items
The top of the page shows four attention cards for quick incident triage:
| Card | Description |
|---|---|
| Abnormal Tasks | Failed, timed-out, or parse-failed task count — click to open the Run Center |
| Abnormal Nodes | Offline node count — click to open Scanning Nodes |
| Running Tasks | Number of tasks currently executing |
| New Assets Today | Number of assets added in the latest statistics day |
Asset Inventory
Shows global count cards for the 8 asset types in the current project:
| Metric | Description |
|---|---|
| Companies | Companies in the current project |
| Domains | Root domains in the current project |
| Subdomains | Subdomains in the current project |
| IPs | IP addresses in the current project |
| Ports | Open ports in the current project |
| Web | Web applications in the current project |
| API | API endpoints in the current project |
| Vulnerabilities | Vulnerabilities in the current project |
Click any asset card to jump to its asset list.
Project Filter
Dashboard data reflects the currently selected project. Switching projects via the top project switcher refreshes the data automatically.
Security Posture
Three charts present the project's overall risk posture:
- Vulnerability Severity Distribution: vulnerabilities by critical/high/medium/low/info;
- Asset Discovery Trend: asset growth curve over time;
- Security Posture Radar: a multi-dimensional overview.
Asset Distribution
Three charts present the exposure structure of your assets:
- Web Service Distribution: service composition of web sites;
- Top 10 Exposed Services: the most exposed services ranking;
- Infrastructure Share: structural share of IPs, ports, and other infrastructure.
Nodes & Tasks
The bottom of the page shows two side-by-side panels:
- Node health: online node count and ratio plus the list of online nodes (🟢 online / 🔴 offline; offline means no heartbeat for about 3 minutes / 180 seconds);
- Recent scan tasks: the latest executed scan tasks (when empty, a "start a scan" shortcut links to the Run Center).
Next Steps
- Asset Management — View and manage all assets
- Workflows — Create and run automated scans
- Run Center — Monitor scanning task execution