
Run Center
During distributed asset enumeration and complex DAG workflow execution, centralized visibility and sub-second status awareness are paramount. TestNet features a dedicated Run Center that aggregates all active, queued, and historical scan executions into a unified operational dashboard.
Dashboard Overview & Status Metrics
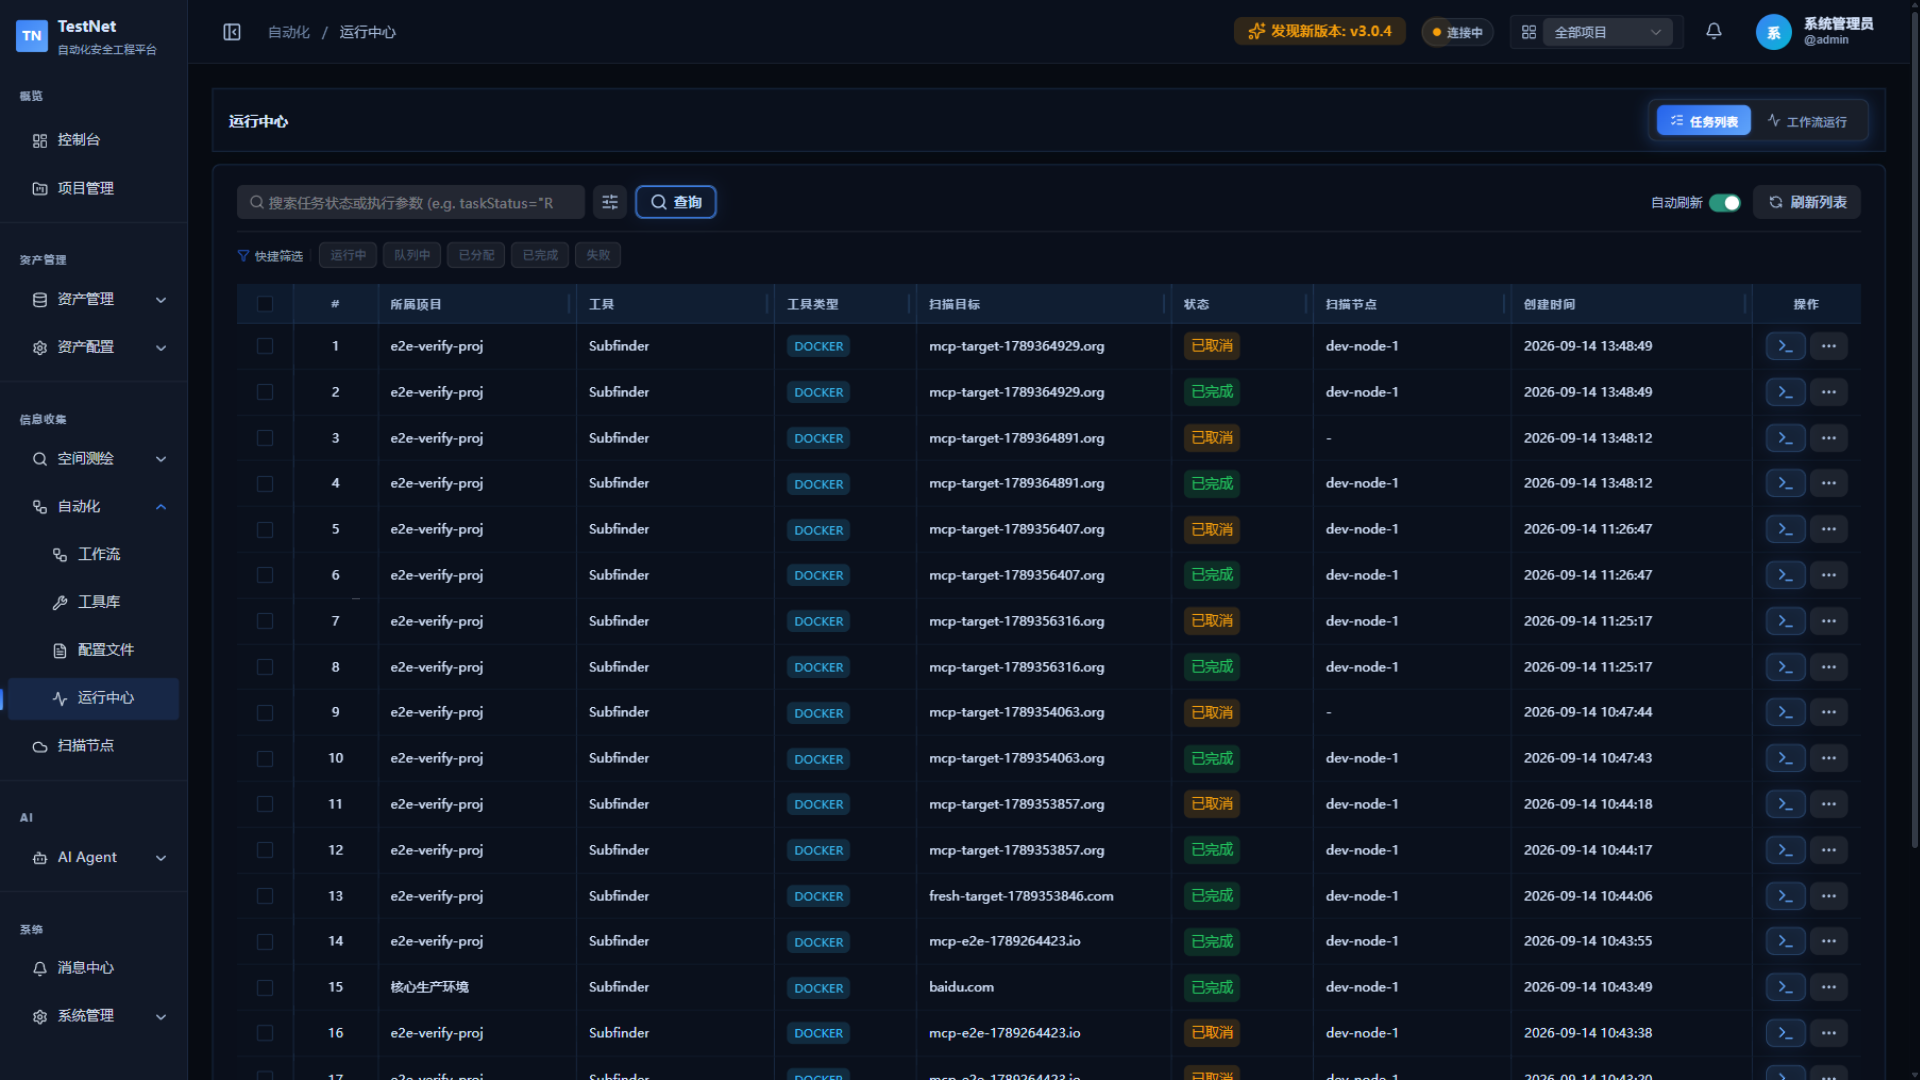
Navigate to "Information Gathering" → "Automation" → "Run Center" (Route: /run-center) in the left navigation menu.
The Run Center provides "Task List" and "Workflow Runs" tabs; the task list includes quick status filters (running, completed, failed, etc.) to narrow the view with one click.
Dual Operational Perspectives
Toggle seamlessly between high-level orchestration and low-level probe executions:
1. Workflow Runs
- Macro Perspective: Tracks end-to-end DAG orchestrations (e.g., Full Reconnaissance & Fingerprinting).
- DAG Progress: Visualizes the completion percentage and execution stages of internal nodes (
subfinder$\rightarrow$httpx$\rightarrow$naabu). - Batch Output Drill-down: From the run details, follow the batch-produced-assets link into the asset library to review every subdomain, port, web app, and vulnerability discovered by the run.
2. Atomic Tasks (Asset Tasks)
- Micro Perspective: Tracks individual binary/Docker commands assigned to specific probe nodes.
- Node Affinity: Shows exactly which client node claimed and executed the task (including node name and IP).
- Latency Auditing: Records timestamps across polling dispatch, probe pickup, execution, and artifact upload.
Real-Time ANSI Log Viewer (LogViewer)
Click "View Logs" in the action column of any task to launch the full-screen / drawer terminal log viewer:
[2026-09-16 10:15:02] [INF] Current target: example.com
[2026-09-16 10:15:03] [INF] Starting Subfinder v2.6.8 with 25 threads
[2026-09-16 10:15:08] [FOUND] admin.example.com [1.2.3.4]
[2026-09-16 10:15:10] [FOUND] vpn.example.com [1.2.3.5]
[2026-09-16 10:15:15] [SUCCESS] Discovered 14 subdomains in 13.2s- ANSI Color Rendering: Preserves original CLI colored output protocols (INFO blue, WARN yellow, ERROR red, SUCCESS green).
- Incremental Polling: The log panel refreshes near-real-time via incremental fetches (since/limit) — no manual page reload needed.
- Instant Search & Highlighting: Enter keywords in the top-right search box to jump directly to matching log lines.
- Auto-Scroll Toggle: Toggle between auto-following the live tail or pinning your scroll position to inspect historical lines.
- Raw Download: Export the entire execution trace as a
.logarchive with a single click.
Execution Control & Self-Healing
Administrators maintain granular control over running scan jobs:
- Abort / Cancel Execution: If a scan was started with improper targets or excessive concurrency, click "Cancel". The server pushes a cancel command to the probe over WebSocket; the probe immediately terminates the corresponding container/process and reclaims resources.
- Instant Re-run: One-click "Re-run" from the task list for tasks that failed due to transient network hiccups.
- Structured Output Inspector: Click "View Output" to inspect the normalized JSON/CSV assets parsed from the raw tool outputs via the Asset Envelope router.
Related Documentation
- Task Lifecycle — the 11 task states and state machine transitions
- Logs & Parsing — live logs and the 7 result parsing pipelines
- Triggers — cron and event-driven workflow run sources